Introducing dial9: a flight recorder for Tokio
March 18, 2026
This is a guest post by Russell Cohen. When Russell showed me dial9, I knew the Tokio community needed to see it. I asked him to write this post and invited him to demo it at TokioConf. — Carl
Like most new things, I built dial9 enroute to solving a problem. Someone came to me for help: they were integrating a new Rust component into their service and found performance issues they could only reproduce in production. The service was concurrently connecting to thousands of other hosts, a scale impossible to reproduce elsewhere. The system behaved well until it hit 90% CPU usage, but beyond that, performance tanked. There was still CPU headroom remaining, so this was surprising.
They already had Tokio runtime metrics, but the data didn't make sense. Workers appeared idle while queues were full. We had theories about what could be causing this, but without a timeline of what was actually happening, we didn't have enough to go on.
We needed a way to see the full sequence of runtime events, and we needed it to be cheap enough to run on their production host. That's why we built dial9. Once we had it running, the cause was obvious: the application had frequent 10ms+ kernel scheduling delays. When you're trying to maintain a latency profile in the 5–10ms range, that's a huge problem.
What is dial9?
dial9 is a runtime telemetry tool for Tokio. Beyond aggregate metrics like "how many tasks are running?" or "what is my p99 poll duration?", dial9 captures the underlying runtime events like individual polls, parks, and wakes as a log rather than as a pool of counters. It combines Tokio runtime events, your own application spans and logs, and Linux kernel events, giving you the full picture of how your application interacts with Tokio and how Tokio interacts with the operating system.
dial9 is on crates.io, you can try it right now.
We'll be at TokioConf! Come find us at our booth and look out for our dial9 lightning talk!
The common issues teams hit running Tokio at scale can sometimes be deduced from aggregate metrics. But the evidence is often circumstantial at best, relying on a deep understanding of internals and how the components interact. Seeing the full timeline of events correlated with the operating system is a different level of debugging. Here are a few examples:
Spotting kernel scheduling delay
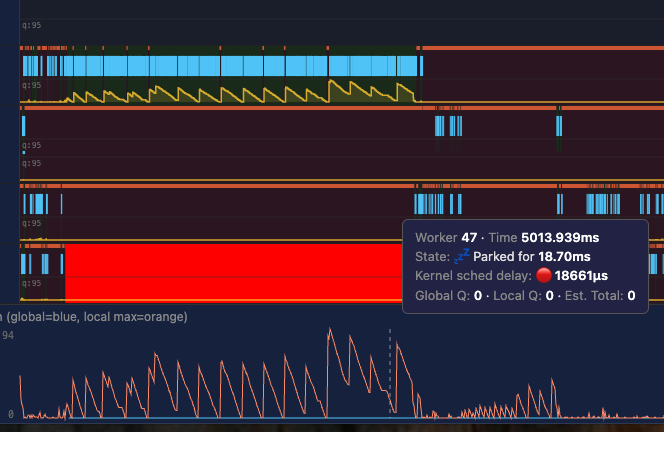
Kernel scheduling delay is the gap between "ready to run" and "actually running" in the OS. Your thread is ready to run, but the kernel doesn't schedule it immediately. dial9 reads kernel metadata on worker park and unpark, so it can see exactly when the kernel started running a worker vs. when it was supposed to start. The busier your host is, the more likely you are to experience kernel scheduling delay.
For the AWS service I mentioned above, we could see frequent 10ms+ scheduling delays. In this screenshot (real data from prod), the runtime attempts to wake up worker 47, but the kernel doesn't actually schedule it for 18ms. During this time, all traffic is being handled by a single worker.
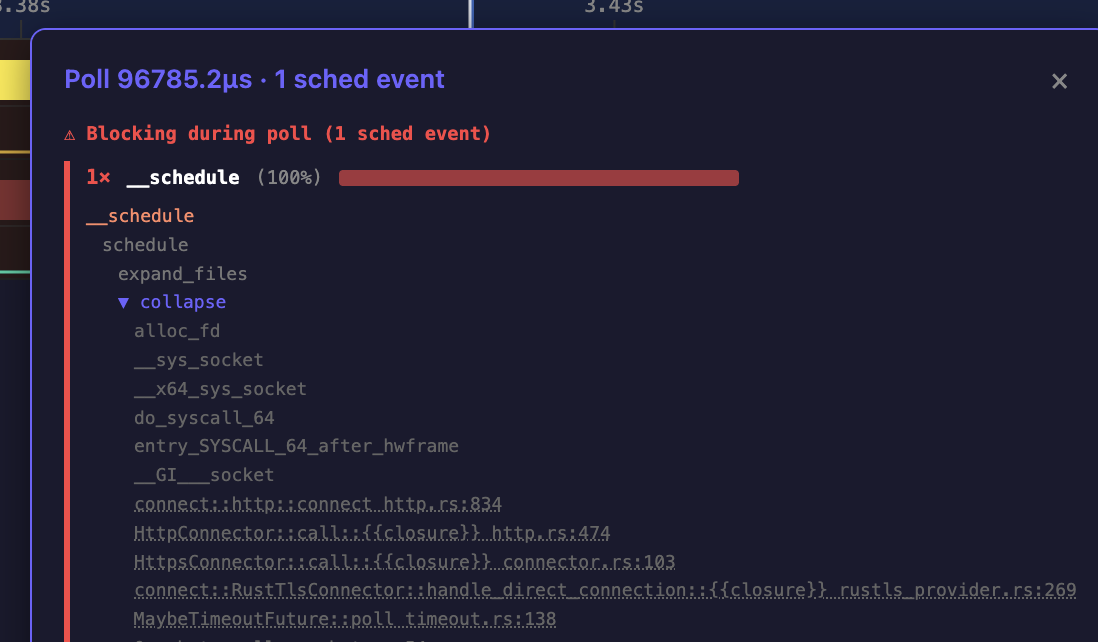
Finding fd_table contention
In another production service, the team was seeing terrible p99 latency during startup. dial9 showed that when opening large numbers of concurrent connections, their tasks were being descheduled when resizing the fd_table. The fd_table tracks open file descriptors, and resizing it requires a lock that blocks all workers trying to open new connections. Contention on this lock was causing 100ms+ polls, delaying the entire application. This is the kind of problem that's nearly impossible to find with aggregate metrics alone.
Tasks are constantly moving
Since dial9 can see the full lifespan of a task and each individual poll, you can watch how an individual task moves across Tokio workers.
Because of the way Tokio's I/O driver works, after your task waits on a socket, the next worker to pick it up is effectively random. Knowing this, I was still surprised to see how pronounced it is in practice. Between stealing and I/O wakeups, tasks frequently bounce across all workers. This illustrates why data-heavy applications can benefit from a runtime-per-core architecture to avoid cache line bouncing.
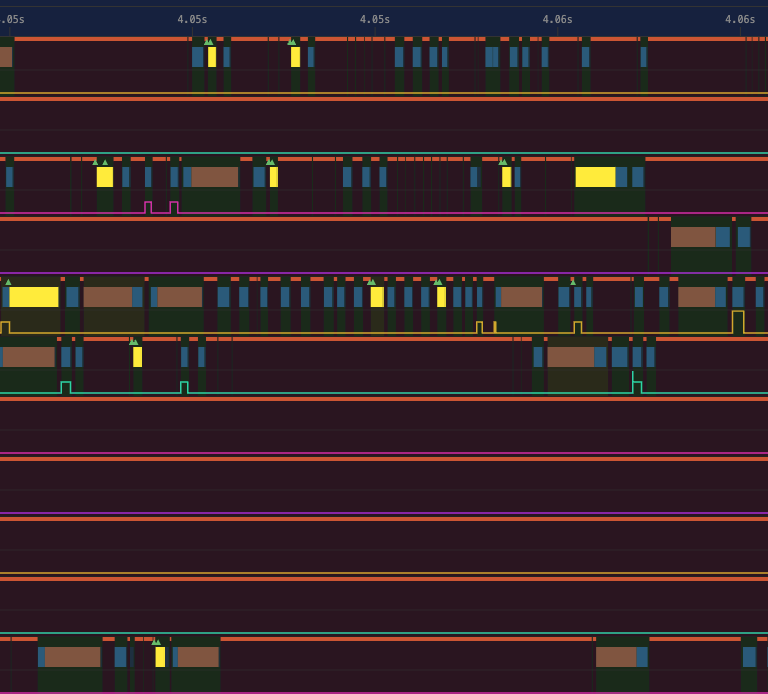
In this trace, you can see how one individual task (highlighted in yellow) hops between 5 different workers over the course of 2ms.
A global lock in backtrace::trace
This last one is a problem inside dial9 that we discovered with dial9.
I started work on adding task dumps to dial9. Whenever a future went Poll::Pending, dial9 would capture a backtrace so you'd know exactly where it yielded. But enabling this took overhead from 5% to 50%. And it got worse as I increased the number of workers.
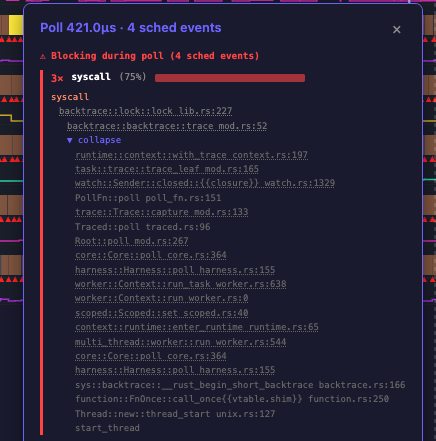
The cause turned out to be obvious once I loaded the traces into dial9. At the time of writing, backtrace::trace takes a global lock. Every worker trying to capture a backtrace was contending on a single mutex. I had assumed you could do frame-pointer unwinding without coordination, and technically you can, but the library acquires a global lock to do it for reasons that are nuanced.
dial9 tracks events where the kernel deschedules your thread because it's waiting on a resource (like a mutex), and captures a stack trace at that exact moment. So looking at the trace, it was obvious: every poll was being descheduled before it finished, waiting to acquire this one lock.
We are still working on task dumps! But first we need to land frame-pointer unwinding and lazy symbolizing for backtraces into Tokio.
Getting started
You can use dial9 right now! Teams are already running it in production (but obviously, as with any new software, use with caution).
Add the dependency: cargo add dial9-tokio-telemetry:
[dependencies]
dial9-tokio-telemetry = "0.2"
Wrap your runtime with TracedRuntime:
use dial9_tokio_telemetry::telemetry::{RotatingWriter, TracedRuntime};

fn main() -> std::io::Result<()> {
    let writer = RotatingWriter::new(
        "/tmp/my_traces/trace.bin",
        20 * 1024 * 1024,   // rotate after 20 MiB
        100 * 1024 * 1024,  // keep at most 100 MiB on disk
    )?;

    let mut builder = tokio::runtime::Builder::new_multi_thread();
    builder.worker_threads(4).enable_all();

    let (runtime, _guard) = TracedRuntime::build_and_start(builder, writer)?;

    runtime.block_on(async {
        // your async code here
    });

    Ok(())
}
That's it. Your traces are in /tmp/my_traces/. Open them in the trace viewer and just drag in a .bin file. There's also a demo trace you can load to see what it looks like. dial9 also supports writing traces directly to S3.
Overhead is typically under 5%. RotatingWriter caps disk usage, so you can leave it running in production.
We'd love feedback. File issues on GitHub.
Finally, a big thank you to everyone who's been making dial9 possible, especially Jess Izen, Mark Rousskov and all of the early adopters at AWS.
See you at TokioConf!